

2025 will be my second time through all the Genuary prompts, once again challenging myself to come up with an image for each day. I will post the daily images on my Mastodon, and will add them here periodically through the month.
Except where otherwise noted, these images were generated using Python code, typically drawing a vector image either directly to an SVG file or to a Cairo surface. The fractal images operate on raw numpy arrays which are converted to images using Pillow. Read more about Genuary here.
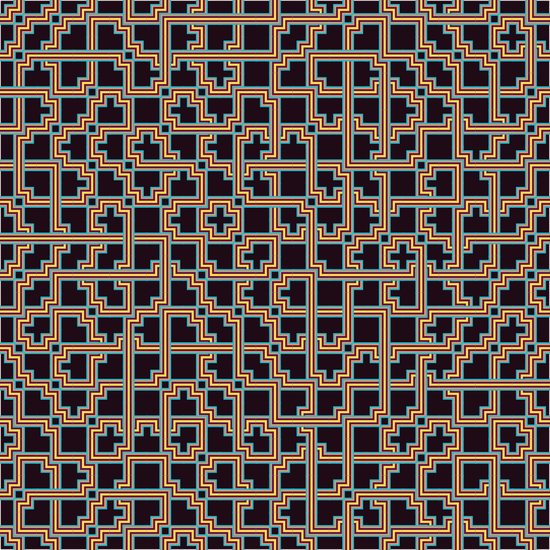
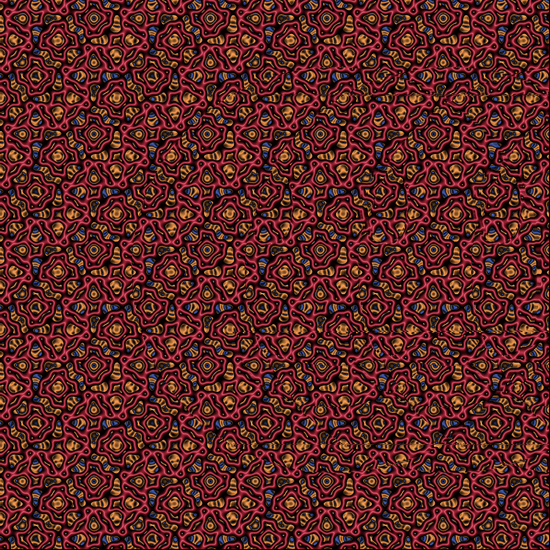
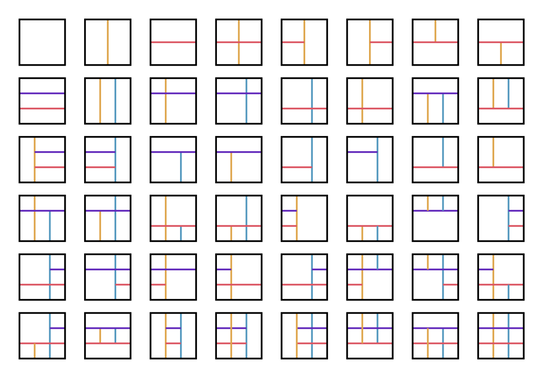
For day 1, I went with a square Truchet tiling pattern where all the tile details are vertical or horizontal. But then I re-read the prompt and wondered if it should be interpreted as "exclusive or" - meaning vertical or horizontal but not both, instead of all lines must be from the union of vertical and horizontal lines. Anyway, Genuary is all about interpretation, so I'm going with my original idea.
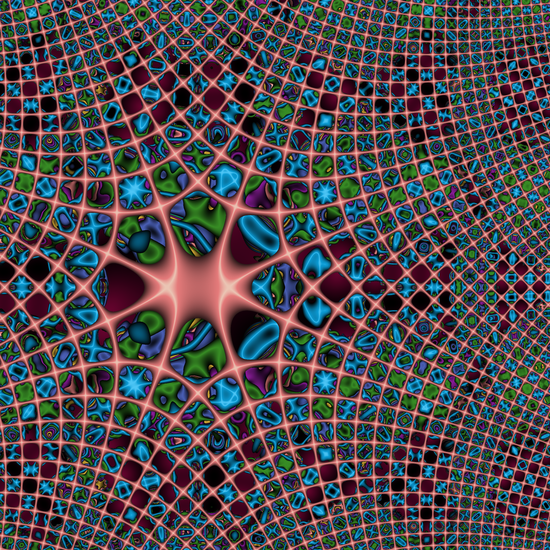
With orbit trap fractals, each time the fractal equation is calculated, another layer is added to the image. The equation for this one just takes the sine and cosine of the real and imaginary values from the standard Mandelbrot equation, trapped by a thin ring around the origin.
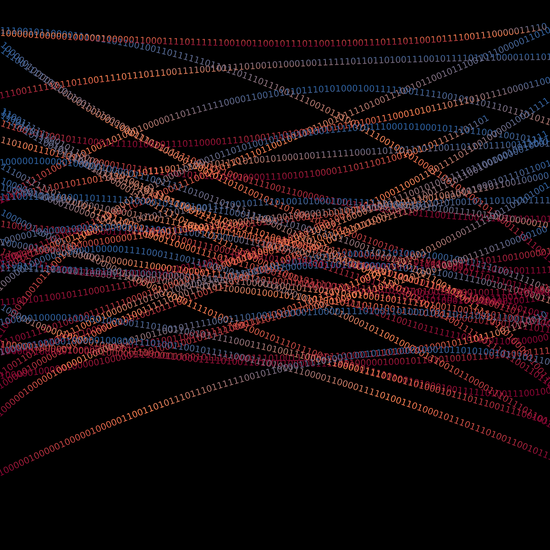
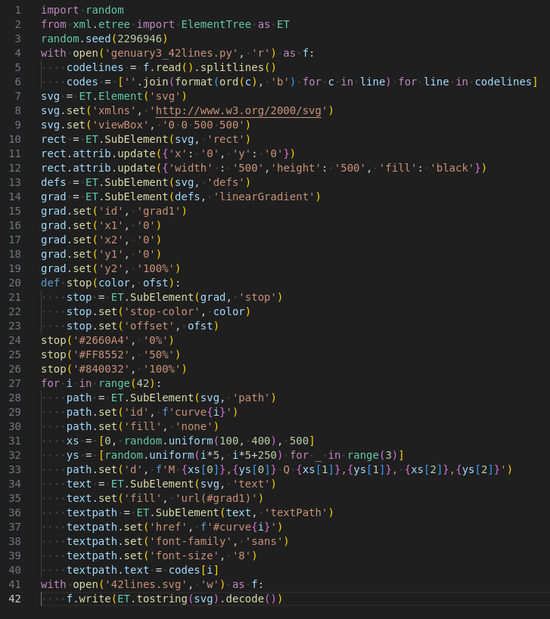
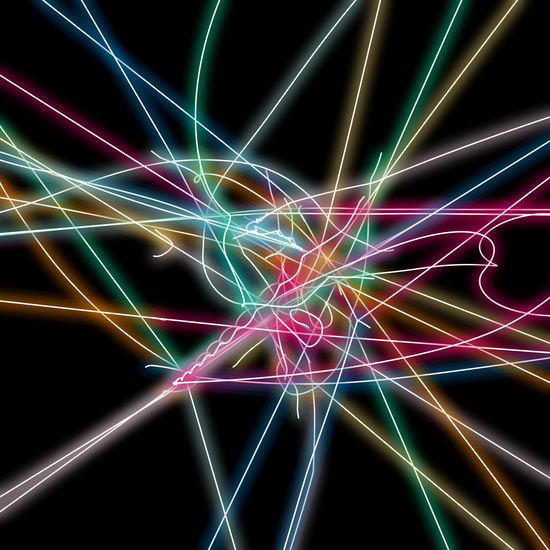
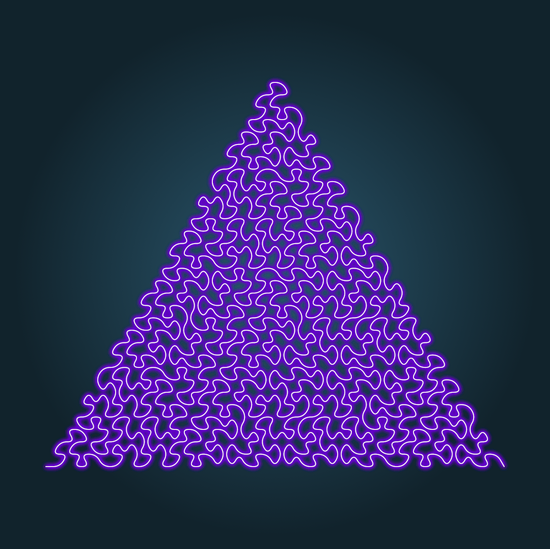
For today's image, I give you exactly 42 lines of code that converts those 42 lines of code into their binary representation to display itself as "42 curves of code". Python standard library only.
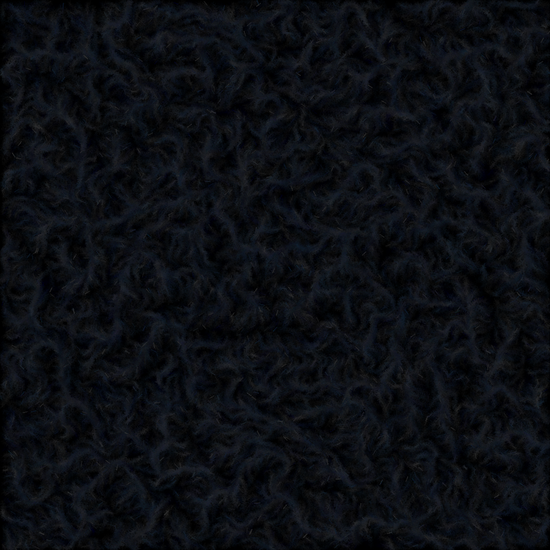
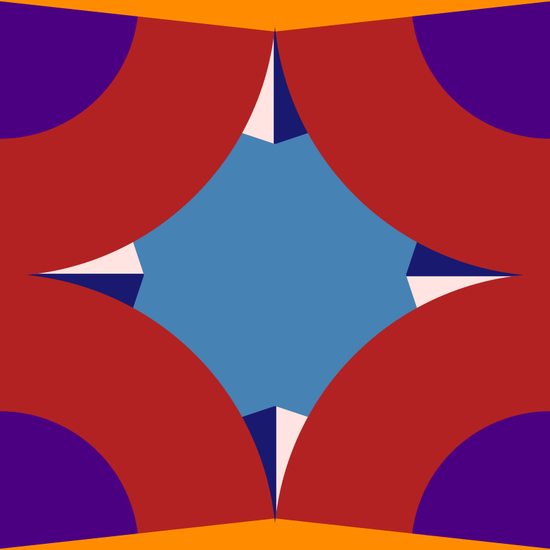
I looked through the XKCD color names to find all the named variations of black - for example "almost black" (#070D0D). There's also "dark" (#1B2431) and midnight (#03012D). This image is made from those color
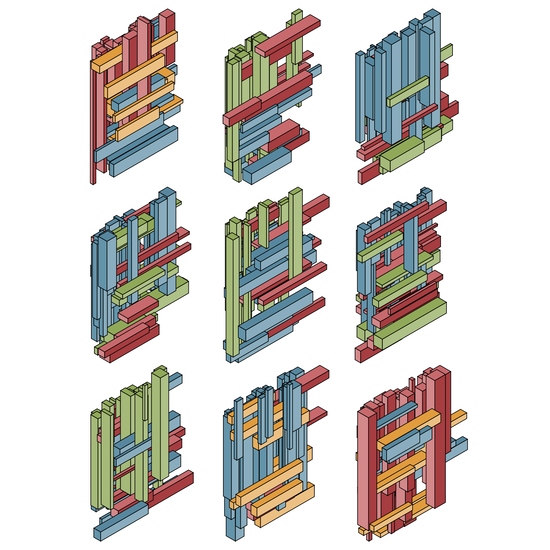
After having fun figuring out the calculations for all the vertices, I made a function to draw rectangular cuboids of any dimensions. Then I used that function to draw blocks of random cuboids. Since this isn't a real 3D model, it occasionally results in some fun physical impossibilities.
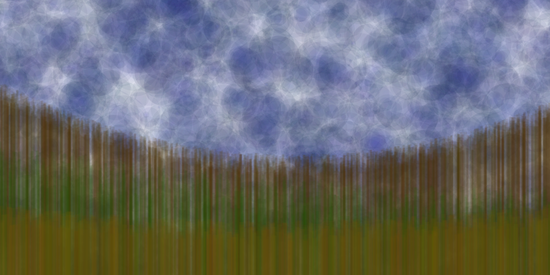
Make a landscape using only primitive shapes. The sky is made of only circles, and the ground only vertical lines. Using transparency and different color shades turns it into a landscape that kind of reminds me of a Bob Ross painting. Or maybe the Windows XP wallpaper.
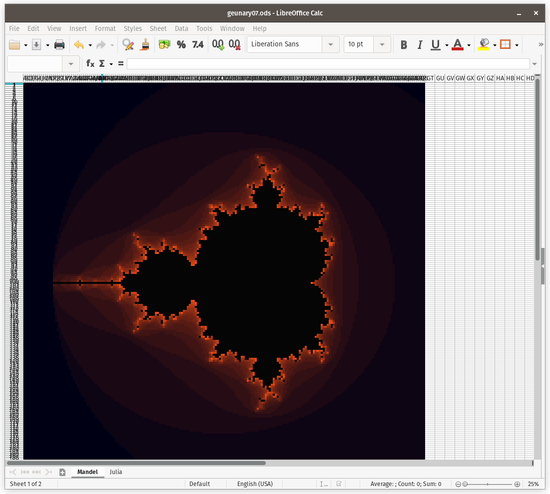
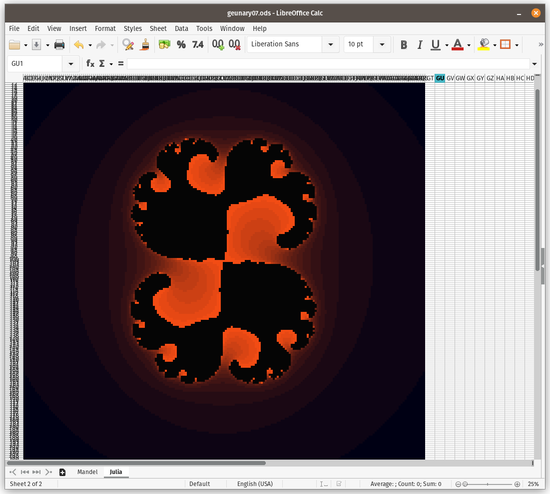
Spreadsheets have to be among the most non-artwork-related software out there. So I made a Mandelbrot and Julia fractal using LibreOffice Calc macros. The macros resize each spreadsheet cell to square, then fill in the cell background with the appropriate color.
The Mandelbrot set is full of good stuff. This image shows the path of a single point iterated through the Mandelbrot equation 1 million times. Given another 20000 iterations or so, the point will finally escape. Finding such points with high escape times is fun, as most randomly-selected points will escape within a hundred or so iterations.
I wanted to do more with this but ran short on time, so this one is more about the color scheme - it reminds me of the bus seats I rode on in grad school.
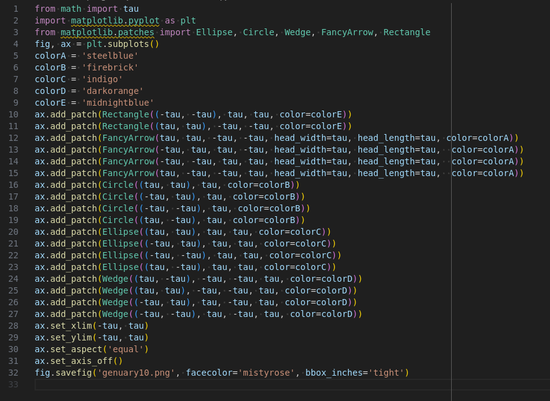
I thought about different ways to approach this one, and how to get other numbers in the code - for example usisng tau/tau for 1, or tau-tau for 0, but I decided to avoid doing those tricks. So I did what I could using Matplotlib shapes (Circle, Rectangle, Ellipse, Wedge, Arrow) that only used tau or -tau in my code. Even the colors use named CSS colors to avoid any numbers.
Inspired by a comment on another of my fractals suggesting it looked like a "Magic Eye" image, I wanted to try turning a fractal image into a 3D autostereogram. Maybe not impossible, but certainly ambitious for a genuary post. I came up with two variations - the first one where each layer of the fractal is rendered at a slightly different zoom level to give the perception of depth. The other uses a depth mask to embed a 3D image by shifting pixels of individuals rows.
A line fractal is a perfect demonstration of subdivision. Each segment (subdivision) of the path is replaced by a copy of the whole. Repeat several times.
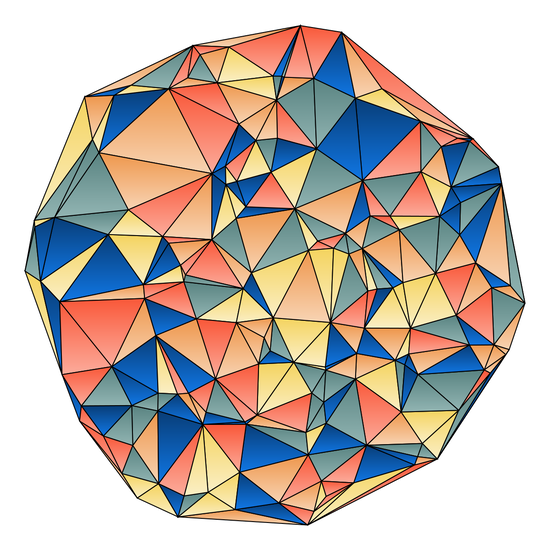
Triangles and nothing else. Here's a lumpy circle made of triangles.
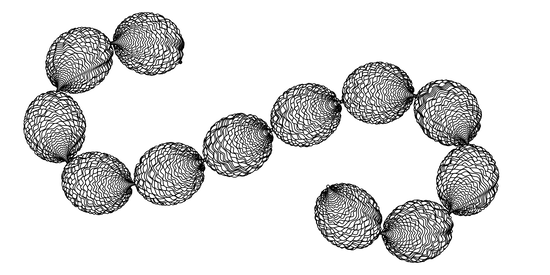
Parametric equations define the overall s-curve and the position and size of the individual wavy circles
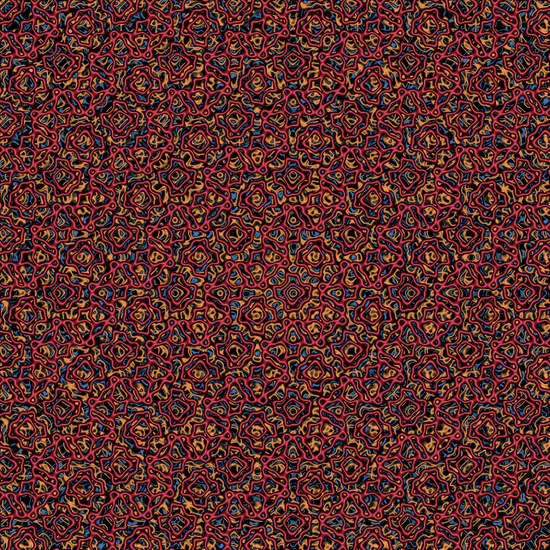
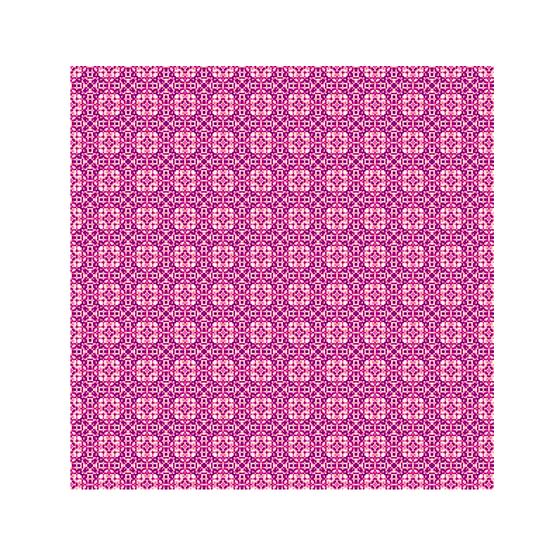
The modulo operator makes for some rug-like designs.
I often use generated color palettes (triadic, square, etc.) for inspiration and as a starting point when coloring my fractals and tweak from there. But I always generate the colors using a red-yellow-blue color wheel rather than the default computer red-green-blue wheel, as the colors come out more natural. Here, I took a fractal and used a square palette (colors separated by 90 degrees on the wheel), and animated it by rotating the base color through the full 360 degrees.
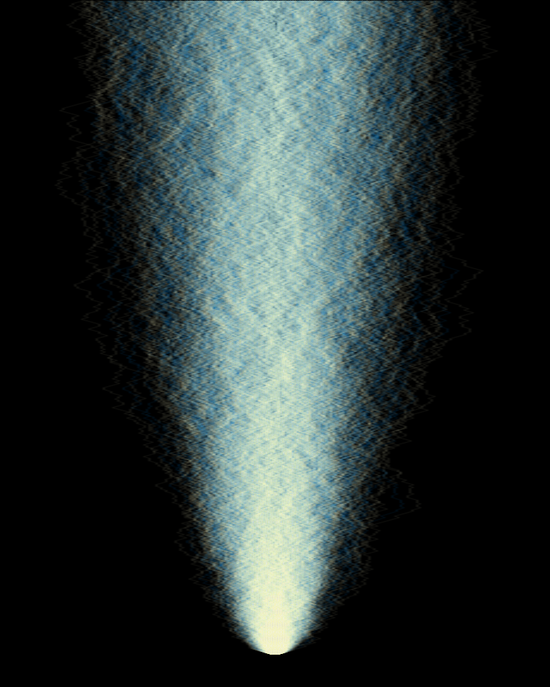
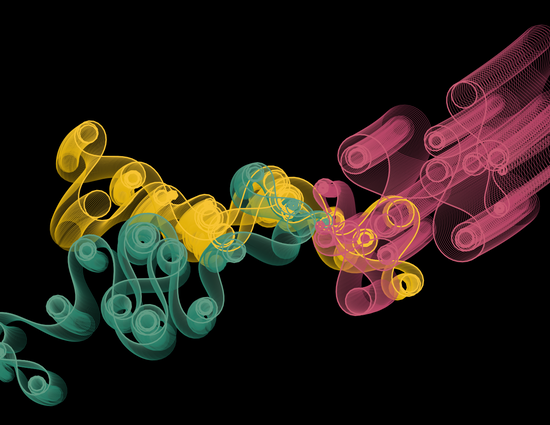
When contemplating how to approach this one, I recalled the fascinating Monte Carlo methods for calculating pi, like counting how many random dots fall inside a circle, or Buffon's needle experiment. A method unfamiliar to me until now method is based on random walk. I had to code it up and try it, and then thought about what would have to change to make pi come out to be 4. Instead of a random walk where each step is randomly either -1 or 1, the steps would need to be approximately -0.885 or +0.885. This image visualizes the difference, with the cream color walks for the regular pi, and the turquoise paths the "pi=4".
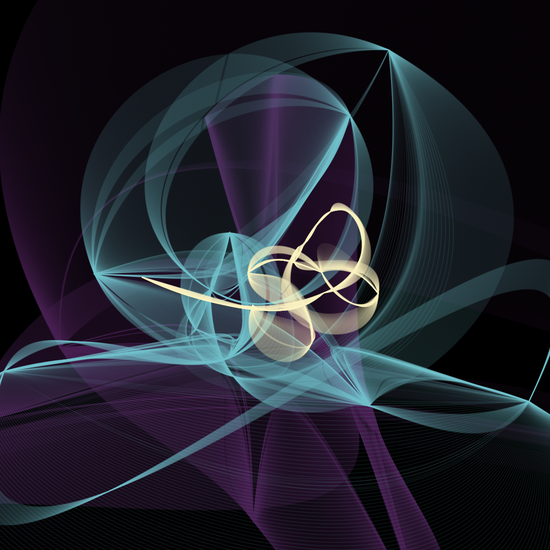
This is an experiment in using Hobby's algorithm for Bézier splines. Three base curves are slightly adjusted 100's of times for each color set.
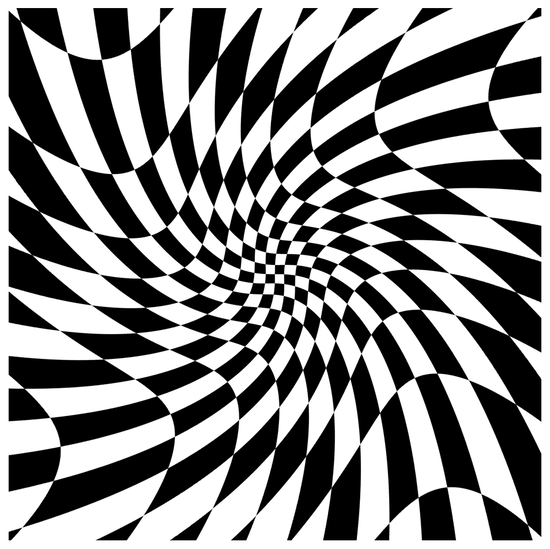
I occasionally experiment with the famous fractal flame algorithm, which uses many spatial transforms in creation of an image. To generate op art, I applied a few of the same transforms to a checkerboard pattern.
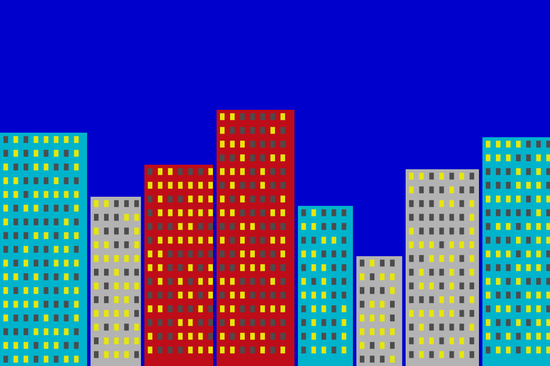
All I kept thinking of was the retro QBasic Gorillas game, where gorillas stand atop a generative city skyline and throw bananas at each other. I coded up a skyline generator to produce the classic look, then thought about modernizing it with a nicer color palette (see also #genuary16 generative palette) and some gradients. And... well that's as far as I got.
Not exactly collision detection, but close, is a simulation of the N-body problem. Here, 40 "planets" interact with each other's gravity.
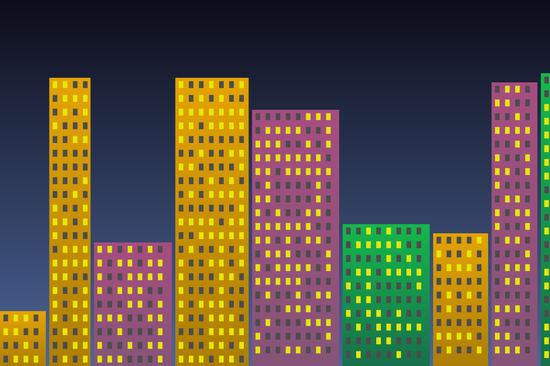
This image is made entirely of linear or radial gradients put through a series of non-linear transforms.
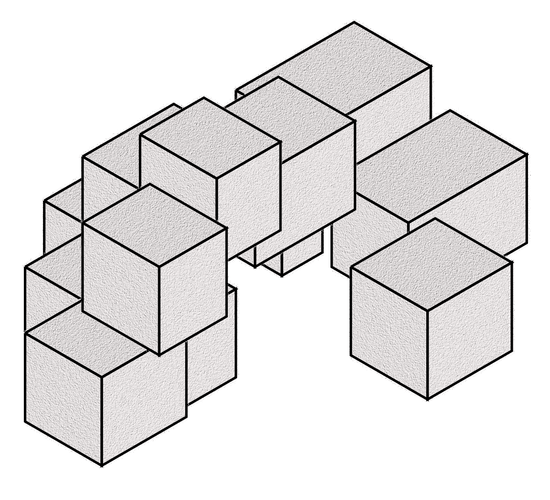
For Brutalism, I returned to my Genuary 5 (isometric) code for drawing cubes, added a concrete texture, and made a building-like arrangement.
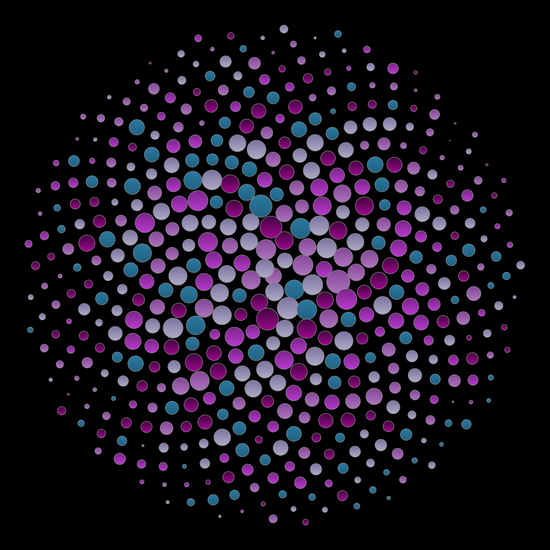
We already did triangles, and rectangles in the form of isomorphic art, so I went with circles. Here they are arranged in a Fibonacci spiral.
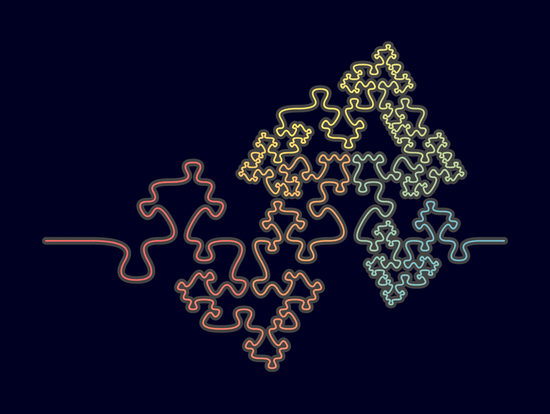
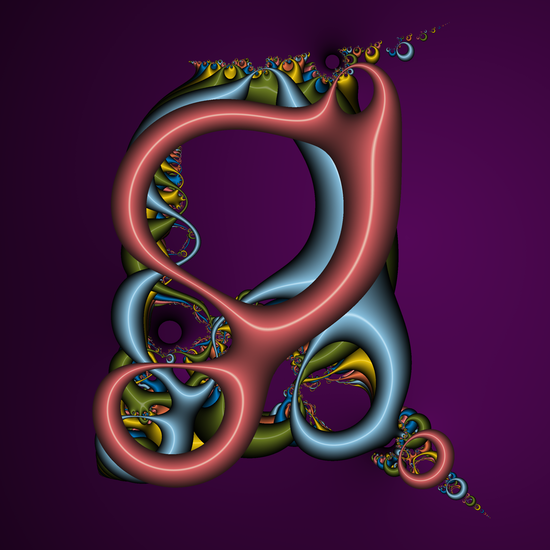
Here is a path that does not intersect itself, made from a line fractal.
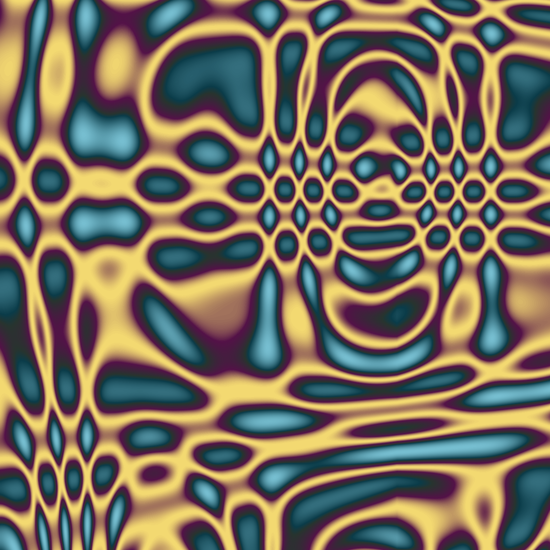
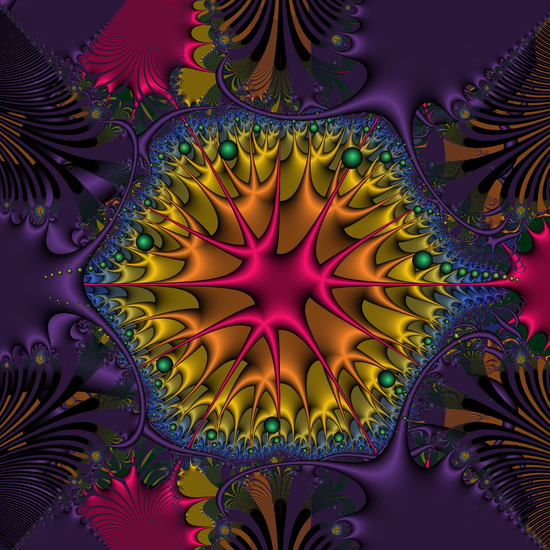
Many of my fractals exhibit some form of symmetry. I chose this one due to both symmetry about the horizontal axis, and rotation symmetry in the main rosette.
Fractal images don't (usually) involve any randomness, yet result in chaotic interesting images.
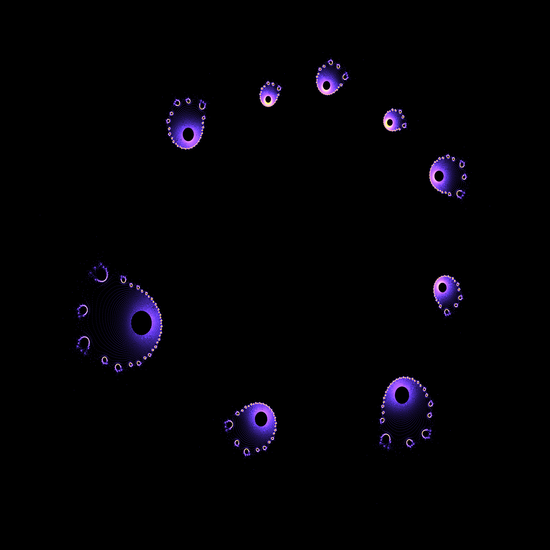
I'm tired of doom-scrolling on my phone so I'm using the definition of scroll as "An ornament or ornamental design that resembles a partially rolled scroll of paper, as the volute in Ionic and Corinthian capitals." These curves are is generated by a parametric equation that results in scroll-like shapes. I suppose it would extend to infinity if there were enough pixels.
Here's a grid of grids.
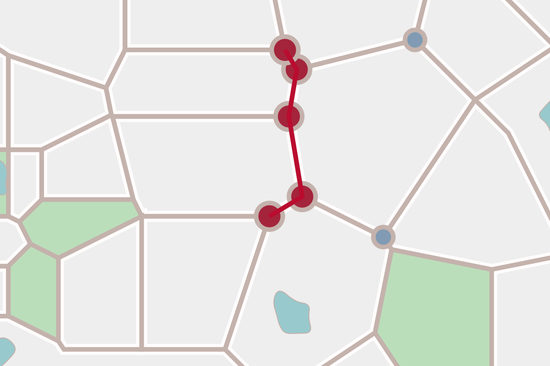
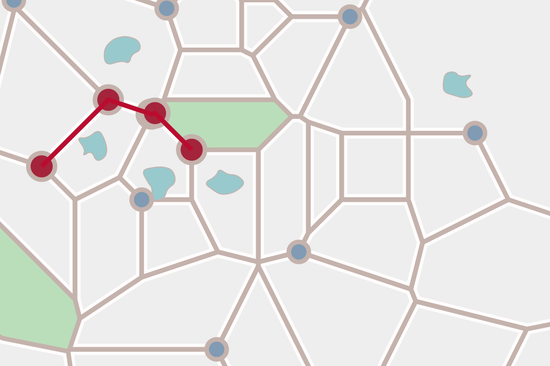
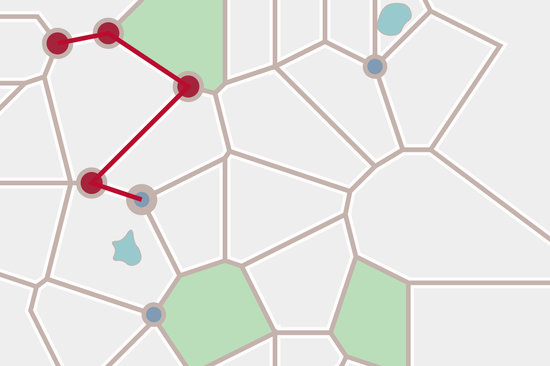
Here is an experiment with using Voronoi diagrams as the basis of a map. Random points in a grid are used as the basis of a Voronoi diagram, with map-like colors filled in. Here are a few results.
Using one of my fractal images as a base, I wrote a pixel sorting algorithm to first convert the RGB color of each pixel to HSV, then sort each column of pixels by hue.
Colophon
Privacy: No cookies, no trackers, no ads.
Copyright © 2026
codeismycanvas.art